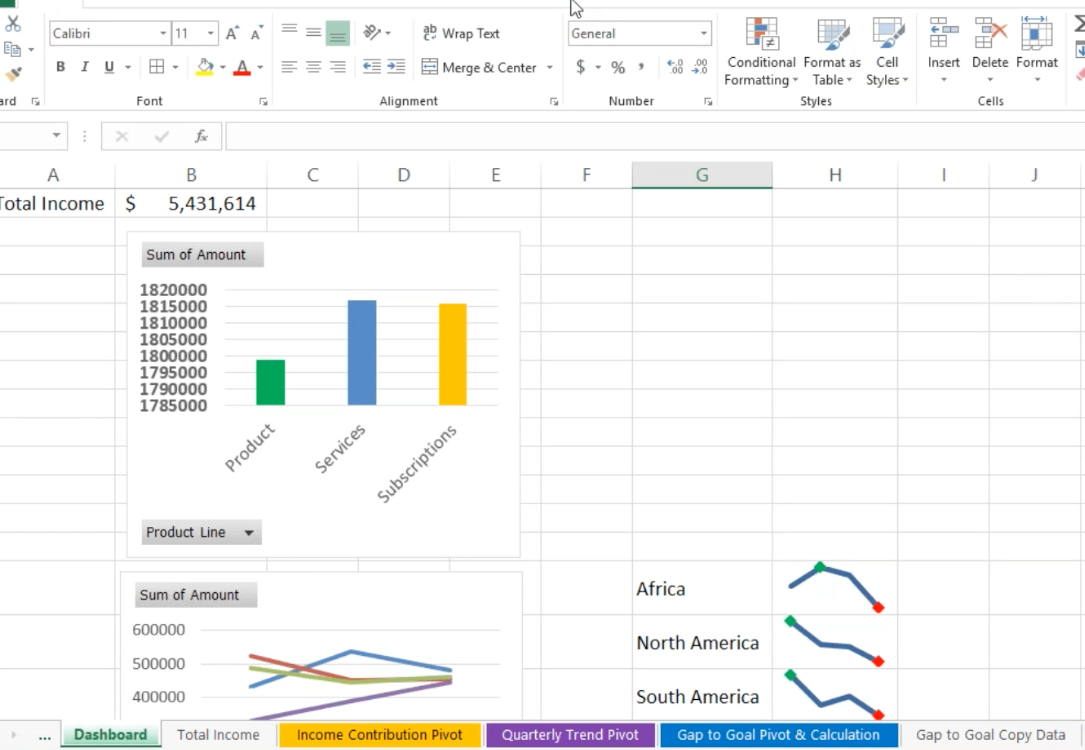
Excel Dashboards 101 for Beginners
Summary
Discover the foundational Excel techniques you need to start building impactful dashboards in just 90 minutes. Transform raw data into clear, actionable insights that drive key business decisions and improve customer service and operations.
What You'll Learn:
- How to customize and source data effectively for your dashboards
- Basic pivot table techniques for creating dynamic reports
- Formatting strategies for clear, easy-to-understand data presentations
- Essential formulas and functions to power your dashboards
What You'll Experience
- Step-by-step guides for importing and managing external data
- Practical demonstrations on using pivot tables in dashboards
- Techniques to add interactivity with dynamic data filtering
- Time-saving conditional formatting methods
Program Overview
This training introduces essential Excel dashboard skills, perfect for beginners or those looking to refine their data visualization abilities.
By joining us, you'll:
- Learn to import data and use pivot tables for more responsive dashboards
- Understand how to apply conditional formatting for clarity and impact
- Develop skills in designing charts and graphs that effectively convey insights
Key Tools and Techniques Covered:
- Import External Data: Start your dashboard with clean, accurate data
- Pivot Tables in Dashboards: Create efficient, detailed reports
- Dynamic Filtering: Enhance interactivity and focus in your dashboards.
- Conditional Formatting: Quickly highlight key data points and trends
- Chart and Graph Design: Build visual elements that maximize data impact
- Data Referencing Techniques: Utilize cell links, GetPivotData, and Named Ranges for dynamic dashboards
- Quick Paste Methods: Efficiently add graphical objects to your reports
Additional Features:
- 15-minute hands-on exercises to enhance your skills immediately
- 30-minute live Q&A to address specific questions and use-cases
Program Benefits
By the end of this training, you’ll have the skills to create effective dashboards that provide valuable insights across various industries and management levels. Improve your reporting, enhance your data analysis, and make more informed business decisions. Advance your Excel knowledge and boost your career with this practical dashboard training!
About The Speaker
Mike Thomas
"Mike Thomas has worked in the IT training business since 1989. He is a subject matter expert in a range of technologies including Microsoft Office and Apple Mac. Mike has produced nearly 200 written and video-based Excel tutorials, and... hundreds of courses and webinars on a wide variety of technology-related topics.
Mike is a Fellow of The Learning and Performance Institute and has worked with and for a large number of global and UK-based companies and organizations across a diverse range of sectors.
In addition to training, he also designs and develops Microsoft Office-based solutions that automate key business tasks and processes."
